The Most Popular Map Projection, Ranked
Voting rules: Choose the map projection you think is the most popular!

Updated on Jul 26, 2024 07:00
Understanding different map projections can greatly enhance anyone's comprehension of geographical data. Map projections help convert the complex, spherical surface of the earth into a two-dimensional map, each bringing a distinct perspective and set of uses. A well-chosen map projection is crucial for accurate representation of geography, whether in education, navigation, or analysis.
This site provides a dynamic ranking of popular map projections, driven by user votes. By participating, users contribute to a broader consensus on the most effective projections for various needs. Each vote helps prioritize certain qualities and uses, aiding others in choosing the right projection for their specific purposes.
What Is the Most Popular Map Projection?
-
187points
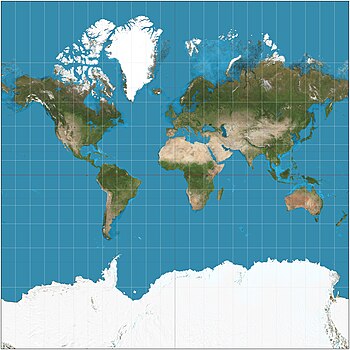
Mercator Projection
A cylindrical map projection presented by the Flemish geographer and cartographer Gerardus Mercator in 1569. It is widely used for navigation charts.- Developed by: Gerardus Mercator
- Type: Cylindrical
- Characteristic: Preserves angles, making it useful for navigation
-
223points
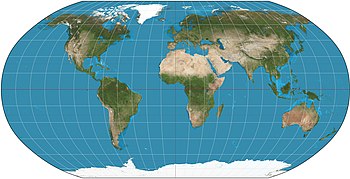
Robinson Projection
A map projection of a world map which shows the entire world at once. It was specifically created in an attempt to find a good compromise to the problem of readily showing the whole globe as a flat image.- Created by: Arthur H. Robinson
- Characteristic: Compromise between showing the whole globe and flat image representation
-
319points
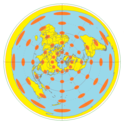
Azimuthal Equidistant Projection
A map projection that preserves distances from a single point to any other point. The resulting map can represent the entire globe in a circular area, used for radio and seismic mapping.- Characteristic: Preserves distances from a single point
- Use: Radio and seismic mapping
-
43points
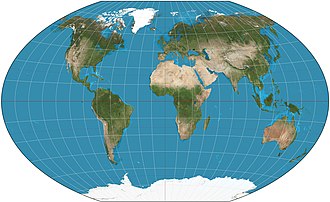
Winkel Tripel Projection
A modified azimuthal map projection known for balancing the distortion of area, direction, and distance. Adopted by National Geographic as their standard world map projection in 1998.- Adopted by: National Geographic
- Year: 1998
- Characteristic: Balances distortion of area, direction, and distance
-
51points
Mollweide Projection
An equal-area, pseudocylindrical map projection generally used where accurate representation of area takes precedence over shape. This projection is used for world maps and astronomical maps.- Type: Pseudocylindrical
- Use: World and astronomical maps
-
60points
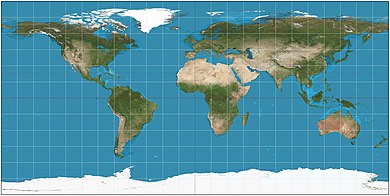
Equirectangular Projection
The simplest form of map projection, representing meridians as equally spaced vertical lines and parallels as equally spaced horizontal lines. This projection is often used for maps of the world and celestial bodies.- Characteristic: Simplest form
- Use: World and celestial body maps
-
70points
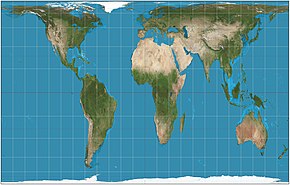
Gall-Peters Projection
A rectangular map projection that maps all areas such that they have the correct sizes relative to each other. Known for its emphasis on equal-area presentation, it has been a subject of controversy due to its distortion of shapes.- Characteristic: Equal-area
- Controversy: Distortion of shapes
-
80points
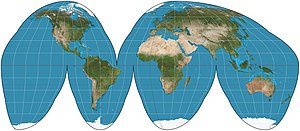
Goode's Homolosine Projection
An interrupted, equal-area, composite map projection used for world maps. It is designed to minimize distortion for the entire world, it interrupts the oceans to preserve the landmasses' shapes.- Type: Interrupted, composite
- Characteristic: Minimizes distortion for the entire world
-
90points
Albers Equal Area Conic Projection
A conic map projection that uses two standard parallels to reduce some of the distortion of other projections. It is particularly useful for mapping large land masses that stretch east-to-west.- Type: Conic
- Characteristic: Reduces distortion using two standard parallels
-
100points
Lambert Conformal Conic Projection
A conic map projection used for aeronautical charts, in which angles around any point are preserved. It is particularly useful for mapping areas with a predominantly east-west orientation.- Type: Conic
- Use: Aeronautical charts
Missing your favorite map projection?
Graphs
Error: Failed to render graph
Discussion
No discussion started, be the first!
About this ranking
This is a community-based ranking of the most popular map projection. We do our best to provide fair voting, but it is not intended to be exhaustive. So if you notice something or projection is missing, feel free to help improve the ranking!
Statistics
- 2010 views
- 133 votes
- 10 ranked items
Voting Rules
A participant may cast an up or down vote for each projection once every 24 hours. The rank of each projection is then calculated from the weighted sum of all up and down votes.
Additional Information
More about the Most Popular Map Projection
Rank #1 for the most popular map projection: Mercator Projection (Source)
Maps help us understand the world. They show us where things are and how to get there. But making a map is not simple. The Earth is round, and maps are flat. This creates a problem. How do we show a round world on a flat piece of paper? The answer is map projections.
A map projection takes the curved surface of the Earth and flattens it. This process always distorts some aspects. It may change the shape, size, distance, or direction of places. Different projections try to minimize these distortions in various ways.
One common way to make a map projection is to use a cylinder. Imagine wrapping a piece of paper around the Earth like a cylinder. Then, transfer the features of the Earth onto this paper. When you unwrap the paper, you get a flat map. This method works well for showing the whole world. It keeps directions accurate, but it can distort sizes, especially near the poles.
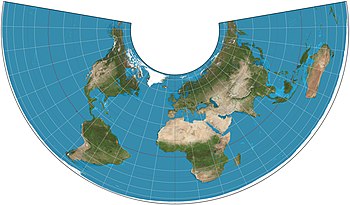
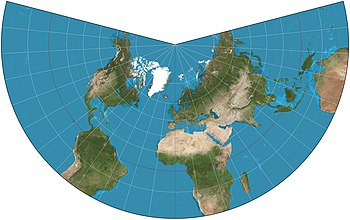
Another method uses a cone. Picture placing a cone over the Earth. The point of the cone touches one of the poles. Then, project the Earth's surface onto the cone. When you unroll the cone, you get a flat map. This type of projection is good for mapping regions with a wide east-west extent. It keeps shapes accurate but can distort distances.
A third method uses a plane. Imagine placing a flat piece of paper against one point on the Earth. Then, project the Earth's surface onto this paper. This works well for mapping small areas. It keeps distances accurate but can distort shapes and sizes.
Each map projection has its strengths and weaknesses. Some are better for navigation. Others are better for showing the true size of countries. Some are good for educational purposes. The choice of projection depends on the map's purpose.
Mapmakers have created many projections over the years. Each one serves a different need. Some projections are very old. Others are quite new. Technology has made it easier to create and use different projections.
Despite the distortions, map projections are essential. They help us see the world in a way that a globe cannot. They allow us to plan trips, study geography, and understand global issues. Maps are tools that shape our view of the world.
People often debate which projection is best. Each person has their preference. Some prefer projections that show the true size of countries. Others like those that keep directions accurate. There is no perfect map projection. Each one is a compromise.
In conclusion, map projections are a vital part of cartography. They help us translate the round Earth onto flat maps. While they all have distortions, they each offer unique benefits. The choice of projection depends on the map's purpose and the user's needs. Whether for navigation, education, or understanding the world, map projections remain crucial tools.
A map projection takes the curved surface of the Earth and flattens it. This process always distorts some aspects. It may change the shape, size, distance, or direction of places. Different projections try to minimize these distortions in various ways.
One common way to make a map projection is to use a cylinder. Imagine wrapping a piece of paper around the Earth like a cylinder. Then, transfer the features of the Earth onto this paper. When you unwrap the paper, you get a flat map. This method works well for showing the whole world. It keeps directions accurate, but it can distort sizes, especially near the poles.
Another method uses a cone. Picture placing a cone over the Earth. The point of the cone touches one of the poles. Then, project the Earth's surface onto the cone. When you unroll the cone, you get a flat map. This type of projection is good for mapping regions with a wide east-west extent. It keeps shapes accurate but can distort distances.
A third method uses a plane. Imagine placing a flat piece of paper against one point on the Earth. Then, project the Earth's surface onto this paper. This works well for mapping small areas. It keeps distances accurate but can distort shapes and sizes.
Each map projection has its strengths and weaknesses. Some are better for navigation. Others are better for showing the true size of countries. Some are good for educational purposes. The choice of projection depends on the map's purpose.
Mapmakers have created many projections over the years. Each one serves a different need. Some projections are very old. Others are quite new. Technology has made it easier to create and use different projections.
Despite the distortions, map projections are essential. They help us see the world in a way that a globe cannot. They allow us to plan trips, study geography, and understand global issues. Maps are tools that shape our view of the world.
People often debate which projection is best. Each person has their preference. Some prefer projections that show the true size of countries. Others like those that keep directions accurate. There is no perfect map projection. Each one is a compromise.
In conclusion, map projections are a vital part of cartography. They help us translate the round Earth onto flat maps. While they all have distortions, they each offer unique benefits. The choice of projection depends on the map's purpose and the user's needs. Whether for navigation, education, or understanding the world, map projections remain crucial tools.
Explore other rankings
Check out some of the other recommended rankings on StrawPoll and make your voice heard.